Your Log Pipeline Is Now a Router
The most important code nobody owns
In a lot of AWS accounts, the code that decides who can read which logs, and for how long they’re kept, is a short Lambda function behind a subscription filter. Someone wrote it to split one crowded log group into a few cleaner ones. It has no tests, its runtime is a version or two behind, and it only gets attention when it throttles during the traffic spike you most needed logs for.
Teams build it because the alternative is worse. Retention and access policies attach to the log group, so when audit events, debug output, and application errors share one group, every setting is a compromise: keep a year of debug noise to satisfy the auditors, or give the security team read access to logs that may hold customer data.
On October 14, AWS shipped a managed replacement for that function. If you’d rather read code first, the sample repo deploys this pipeline in CloudFormation, CDK, or Terraform, with a config that passes AWS’s validator.
What AWS shipped
Amazon CloudWatch pipelines now supports conditional log routing and chained parsers (announcement). Pipelines is the managed collector that ingests, transforms, and routes telemetry into CloudWatch, so there is no infrastructure to run.
Conditional routing sends each event to a different CloudWatch log group based on conditions evaluated against fields the pipeline has already processed, so you can split by severity, source, or event type. Chained parsers run several parser processors in sequence, with later parsers reading fields that earlier ones produced; AWS’s own example parses a JSON envelope first, then runs Grok on a field inside it.
It works in all commercial Regions where pipelines is generally available, through the console, CLI, or SDKs. Pipelines itself adds no charge on top of standard log ingestion (docs).
How it fits together
Picture a service that emits JSON events where the useful text sits in a nested message field. One pipeline handles the whole path:
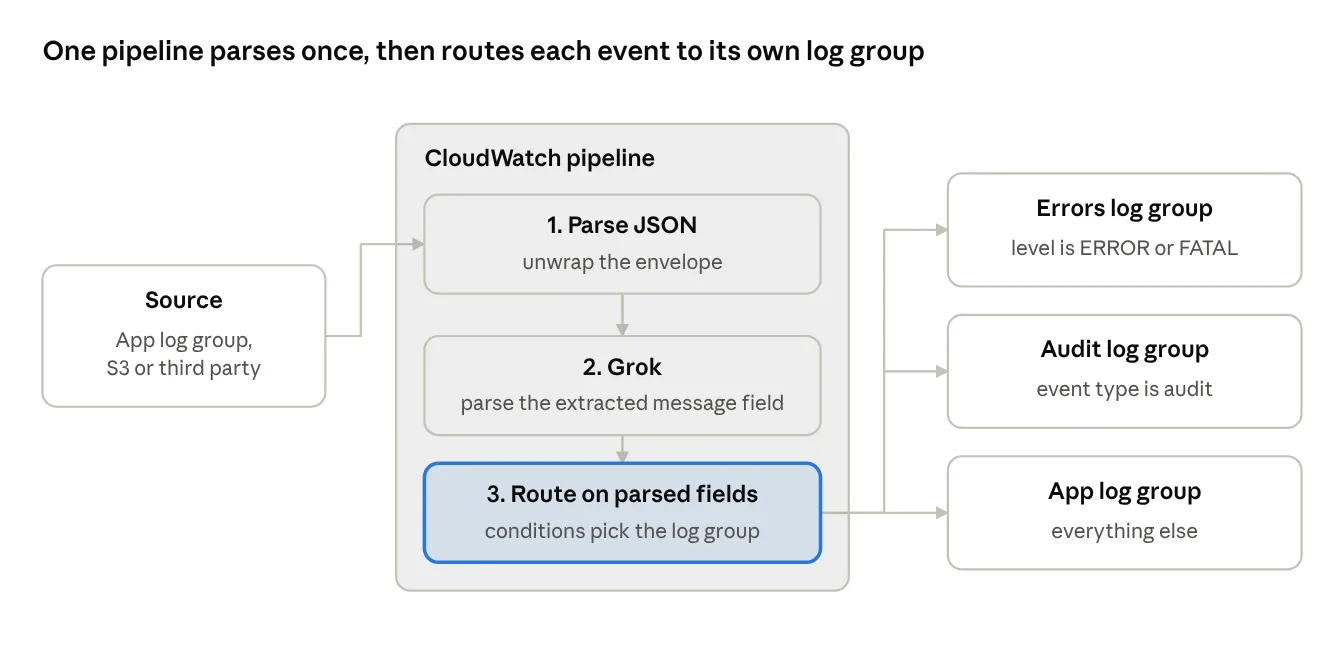
The JSON parser lifts out the envelope, Grok structures the message it extracted, and the routes read those new fields to choose a destination. The three log groups and their conditions are my example, not an AWS default; your split should follow who reads the logs. The pipeline, its log groups, and its role are in a sample repo, in CloudFormation, CDK, and Terraform.
Where a log lands is now a configuration choice
The feature list looks small, but it moves a decision most teams handle with custom code: where each log event ends up. That choice now lives in one pipeline definition at ingestion, and it answers each of the problems above.
Retention stops being one compromise. CloudWatch sets retention per log group, so once audit events land in their own group they can stay as long as compliance requires while debug output expires in days. You stop paying to keep noise just because the auditors needed something else stored next to it.
Access gets narrower. IAM policies also attach to log groups, so the security team can read authentication events without being granted every application log that might hold customer data.
The Lambda router goes away. A subscription filter plus a function is a small service with its own throttling, errors, alarms, and runtime upgrades, and moving that logic into a managed pipeline takes it off your on-call rotation.
I think chained parsers are the underrated half. Real logs are nested: a container platform wraps your application’s plain-text line in a JSON envelope, and the field you want to route on, the log level, sits inside that line. A route can only test a field the parsers extracted, so routing without chained parsing would miss most real workloads.
What I’d watch before rolling it out
Processing changes the event permanently. The pipelines docs say processors mutate log events and the raw log is not kept, so if you need the original line for forensics or audit, plan for that before adding parsers.
A logs pipeline accepts up to 20 processors and up to 10 ordered CloudWatch Logs sinks, which are what routes fan out to. Ten destinations covers most teams, but design the route map with that limit in mind.
Metering depends on the source. CloudWatch Logs sources are metered before processing, while S3 and third-party sources count as custom logs and are metered after, so routing alone won’t lower your ingestion bill; shorter retention on the noisy groups is where the savings come from.
At the time of writing, the processor compatibility page still says parsers must be the first processor, which conflicts with chained parsers. Validate configurations with the ValidateTelemetryPipelineConfiguration and TestTelemetryPipeline APIs before trusting a chain in production.
Finally, pipeline definitions are not encrypted with customer-managed keys, so credentials belong in Secrets Manager, not in the config.
Where I’d start
Pick one noisy log group, the one everyone complains about. Write down the two or three kinds of events inside it and who needs each one. That list is your route map: one destination log group per audience, each with its own retention and access policy.
Then build one pipeline for that source, test it with sample events, and retire the Lambda router it replaces. If it runs cleanly for a few weeks, move to the next log group.
What’s the messiest log group in your environment? I’d like to hear how you’d split it.
Sources
- Amazon CloudWatch announces log routing and chained log parsers, AWS What’s New, Oct 14, 2026
- Sample code for this post, GitHub
- CloudWatch pipelines, Amazon CloudWatch User Guide
- Processor compatibility and restrictions, Amazon CloudWatch User Guide
- Expression syntax for conditional processing, Amazon CloudWatch User Guide
The opinions on this blog are my own and do not represent the views of my employer.